
Technical Analysis
Technical Analysis is a methodology used in trading to evaluate investments and identify trading opportunities by analyzing statistical trends gathered from trading activity, such as price movement and volume. It involves studying historica…
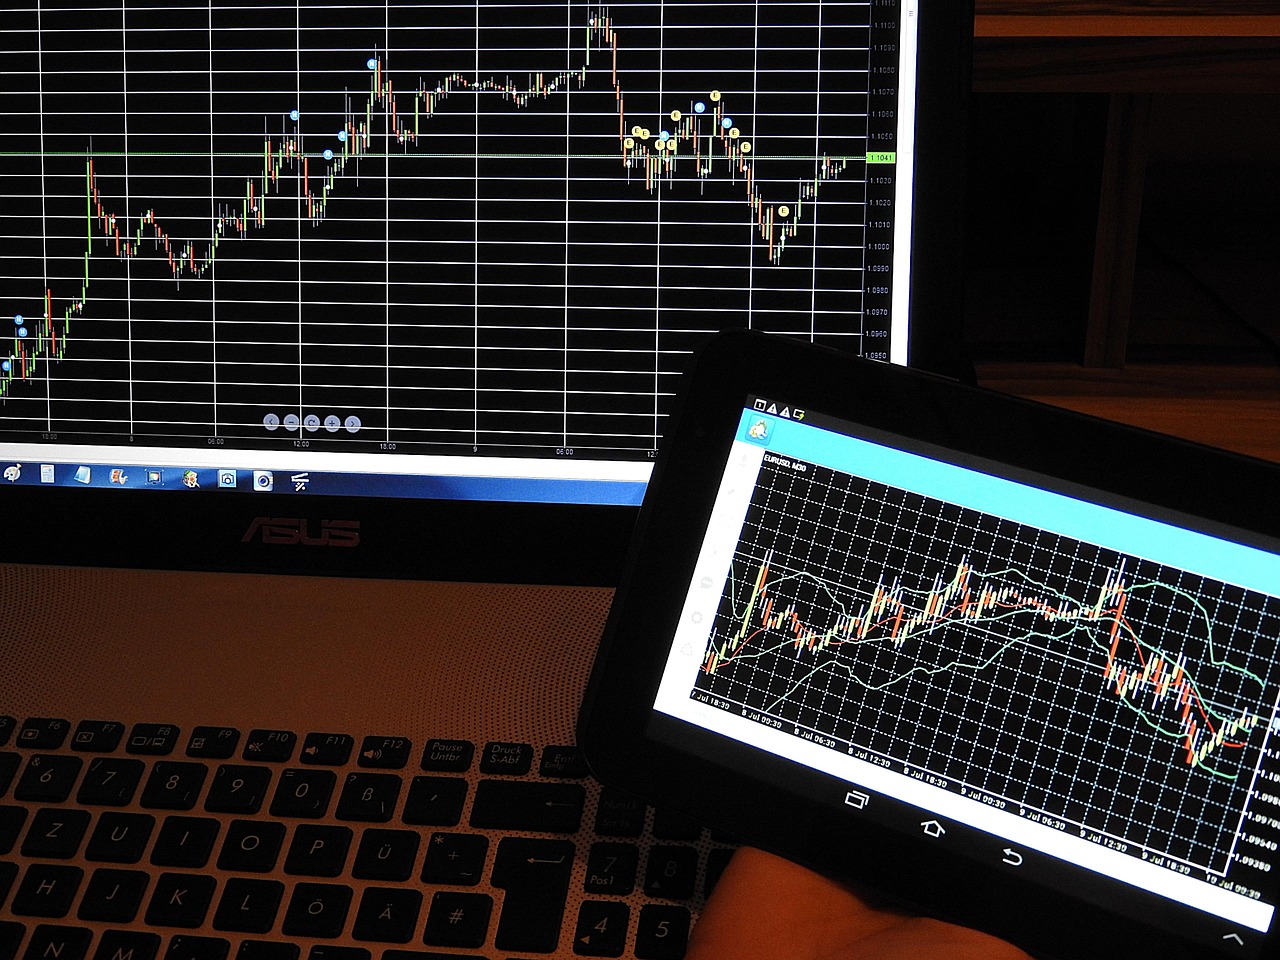
Technical Analysis is a methodology used in trading to evaluate investments and identify trading opportunities by analyzing statistical trends gathered from trading activity, such as price movement and volume. It involves studying historical price charts to predict future price movements, enabling traders to make informed decisions.
Key Terms and Vocabulary:
1. **Support and Resistance**: Support and resistance levels are key concepts in technical analysis. Support is a price level where a downtrend can be expected to pause or reverse due to a concentration of demand. Resistance is a price level where an uptrend can be expected to pause or reverse due to a concentration of supply.
2. **Trend Lines**: Trend lines are used to identify and confirm trends. An uptrend is formed by connecting higher lows, while a downtrend is formed by connecting lower highs.
3. **Moving Averages**: Moving averages smooth out price data to identify trends over a specified period. Common types include simple moving averages (SMA) and exponential moving averages (EMA).
4. **Relative Strength Index (RSI)**: The RSI is a momentum oscillator that measures the speed and change of price movements. It ranges from 0 to 100 and is typically used to identify overbought or oversold conditions.
5. **MACD (Moving Average Convergence Divergence)**: MACD is a trend-following momentum indicator that shows the relationship between two moving averages of a security's price. Traders use it to identify potential buy and sell signals.
6. **Fibonacci Retracement**: Fibonacci retracement levels are horizontal lines that indicate areas of support or resistance based on key Fibonacci ratios. Traders use these levels to predict potential price reversals.
7. **Candlestick Patterns**: Candlestick patterns are graphical representations of price movements over a certain period. They can indicate market sentiment and potential reversals or continuations.
8. **Volume**: Volume is the number of shares or contracts traded in a security or market during a given period. Changes in volume can provide insights into the strength of a trend.
9. **Bollinger Bands**: Bollinger Bands are volatility bands placed above and below a moving average. They expand and contract based on market volatility, helping traders identify overbought or oversold conditions.
10. **Chart Patterns**: Chart patterns are distinct formations that appear on price charts and can indicate potential future price movements. Common patterns include head and shoulders, triangles, and flags.
11. **Breakout**: A breakout occurs when the price of a security moves through a support or resistance level, signaling a potential trend reversal or continuation.
12. **Divergence**: Divergence occurs when the price of a security moves in the opposite direction of a technical indicator, such as the RSI or MACD. It can signal a potential trend reversal.
13. **Overbought and Oversold**: Overbought and oversold conditions occur when a security's price has moved significantly in one direction, potentially leading to a reversal. The RSI is commonly used to identify these conditions.
14. **Moving Average Convergence Divergence (MACD)**: MACD is a popular technical indicator that shows the relationship between two moving averages of a security's price. Traders use it to identify potential buy and sell signals.
15. **Ichimoku Cloud**: The Ichimoku Cloud is a comprehensive indicator that provides information about support and resistance levels, trend direction, and momentum. It consists of five lines that help traders make informed decisions.
16. **Parabolic SAR**: The Parabolic SAR (Stop and Reverse) is a trend-following indicator that provides potential entry and exit points. It appears as dots above or below price movements, indicating potential reversals.
17. **Average True Range (ATR)**: The ATR measures market volatility by calculating the average range between the high and low prices over a specified period. Traders use it to set stop-loss orders and determine position sizes.
18. **Stochastic Oscillator**: The Stochastic Oscillator is a momentum indicator that compares a security's closing price to its price range over a certain period. It ranges from 0 to 100 and is used to identify overbought or oversold conditions.
19. **Elliot Wave Theory**: Elliot Wave Theory is a method of technical analysis that identifies recurring wave patterns in financial markets. It suggests that market trends move in predictable cycles consisting of five waves.
20. **Risk Management**: Risk management is a crucial aspect of trading that involves assessing and mitigating potential risks to protect capital. Traders use tools like stop-loss orders and position sizing to manage risk effectively.
21. **Backtesting**: Backtesting is the process of testing a trading strategy using historical data to evaluate its effectiveness before risking real capital. It helps traders optimize their strategies and identify potential pitfalls.
22. **Leverage**: Leverage allows traders to control a larger position with a smaller amount of capital. While it can amplify profits, it also increases the risk of significant losses.
23. **Margin Call**: A margin call occurs when a trader's account falls below the required margin level, prompting the broker to request additional funds or close out positions to cover the shortfall.
24. **Slippage**: Slippage is the difference between the expected price of a trade and the actual price at which it is executed. It can occur during periods of high volatility or low liquidity.
25. **Arbitrage**: Arbitrage is the practice of exploiting price differences of the same asset on different markets to make a profit. It requires quick execution and is often automated by algorithms.
26. **Quantitative Analysis**: Quantitative analysis involves using mathematical and statistical models to evaluate financial assets and make trading decisions. It relies on data and algorithms to identify patterns and trends.
27. **Sentiment Analysis**: Sentiment analysis involves gauging the overall mood or attitude of market participants towards a particular asset or market. It can provide insights into potential price movements.
28. **Algorithmic Trading**: Algorithmic trading, also known as algo trading or automated trading, uses pre-programmed instructions to execute trades automatically based on predefined criteria. It can be used for high-frequency trading or to remove emotions from trading decisions.
29. **Risk-Reward Ratio**: The risk-reward ratio is a measure of the potential profit compared to the potential loss of a trade. Traders aim to have a positive risk-reward ratio to ensure that winning trades outweigh losing trades.
30. **Drawdown**: Drawdown is the peak-to-trough decline in a trading account's equity. It measures the largest loss experienced before a new high is reached and is used to assess a trader's risk tolerance.
31. **Pyramiding**: Pyramiding is a trading strategy where additional positions are added to a winning trade. Traders increase their position size as the trade moves in their favor to maximize profits.
32. **Position Sizing**: Position sizing is the process of determining the appropriate amount of capital to risk on a single trade based on factors such as account size, risk tolerance, and market conditions.
33. **Mean Reversion**: Mean reversion is the theory that prices tend to revert to their historical averages over time. Traders use this concept to identify potential buying or selling opportunities.
34. **Correlation**: Correlation measures the relationship between two or more assets or markets. Positive correlation means the assets move in the same direction, while negative correlation means they move in opposite directions.
35. **Volatility**: Volatility is the degree of variation in a trading price series over time. High volatility indicates rapid price changes, while low volatility indicates stable price movements.
36. **Liquidity**: Liquidity refers to how easily an asset can be bought or sold without significantly affecting its price. Highly liquid assets have many buyers and sellers, reducing the impact of large trades.
37. **Hedging**: Hedging is a risk management strategy that involves taking offsetting positions to protect against potential losses. Traders use derivatives or other assets to hedge their existing positions.
38. **Gaps**: Gaps occur when the price of a security opens significantly higher or lower than the previous close. Traders pay attention to gaps as they can indicate potential breakouts or reversals.
39. **Crossover**: A crossover is a technical analysis term that refers to the point where a short-term moving average crosses above or below a long-term moving average. It can signal a potential change in trend.
40. **Whipsaw**: A whipsaw occurs when a trader is caught in a losing position due to a false signal. It can happen when the market experiences sudden reversals or choppy price movements.
41. **Pattern Recognition**: Pattern recognition involves identifying recurring formations in price charts that may indicate potential future price movements. Traders use these patterns to make informed decisions.
42. **Noise**: Noise refers to random price movements that are not part of a discernible trend. Traders aim to filter out noise to focus on meaningful price movements and patterns.
43. **Confirmation**: Confirmation is the process of validating a trading signal using multiple indicators or methods. Traders seek confirmation to increase the probability of a successful trade.
44. **Time Frame**: The time frame refers to the duration over which price data is analyzed. Traders use different time frames, such as daily, weekly, or intraday, to make trading decisions based on their strategies.
45. **Scalping**: Scalping is a trading strategy that involves making small profits from frequent trades over short time frames. Scalpers aim to capitalize on small price movements throughout the day.
46. **Swing Trading**: Swing trading is a trading style that aims to capture short- to medium-term gains by holding positions for several days to weeks. Swing traders focus on capturing price swings within a trend.
47. **Day Trading**: Day trading involves buying and selling financial instruments within the same trading day. Day traders aim to capitalize on intraday price movements and close out positions before the market closes.
48. **Position Trading**: Position trading is a long-term trading strategy where positions are held for weeks, months, or even years. Position traders focus on fundamental analysis and trends to make trading decisions.
49. **Scalability**: Scalability refers to the ability of a trading strategy to perform consistently across different market conditions and time frames. Scalable strategies can adapt to changing market environments.
50. **Artificial Intelligence (AI)**: Artificial intelligence is a branch of computer science that enables machines to mimic human intelligence. AI algorithms are used in trading to analyze vast amounts of data and make informed decisions.
In conclusion, mastering the key terms and vocabulary of Technical Analysis is essential for traders looking to navigate the complex world of financial markets. By understanding these concepts and applying them effectively, traders can make informed decisions, manage risk, and maximize profits in their trading activities.
Key takeaways
- Technical Analysis is a methodology used in trading to evaluate investments and identify trading opportunities by analyzing statistical trends gathered from trading activity, such as price movement and volume.
- Resistance is a price level where an uptrend can be expected to pause or reverse due to a concentration of supply.
- An uptrend is formed by connecting higher lows, while a downtrend is formed by connecting lower highs.
- **Moving Averages**: Moving averages smooth out price data to identify trends over a specified period.
- **Relative Strength Index (RSI)**: The RSI is a momentum oscillator that measures the speed and change of price movements.
- **MACD (Moving Average Convergence Divergence)**: MACD is a trend-following momentum indicator that shows the relationship between two moving averages of a security's price.
- **Fibonacci Retracement**: Fibonacci retracement levels are horizontal lines that indicate areas of support or resistance based on key Fibonacci ratios.